UAA performance
Page last updated:
This topic provides an overview of the configuration and results of performance tests conducted on the UAA API. It does not discuss log outputs or metrics.
For information about monitoring and diagnosing UAA performance over time, see UAA performance metrics.
The performance test results illustrate the baseline performance of a single instance and expected performance when horizontally scaling the number of UAA virtual machine (VM) instances.
The graphs in this topic are presented as time series and describe the effect of increasing concurrency on throughput and latency. Operators can use this information to determine the number of instances required to achieve a target throughput under reasonable latency.
Benchmarking
UAA testing for this topic was performed in the context of a Cloud Foundry environment instead of in full isolation tests.
The benchmarking test setup places the database, client, router, and UAA servers within the same network to minimize external network factors on performance. The test setup relies on Gorouter to load balance requests across multiple UAA instances.
The Apache JMeter client increases step concurrency to reach the target currency for a given test run. The testing tools are packaged as a BOSH release and deployed to a dedicated VM. The performance tests exercise the following flows:
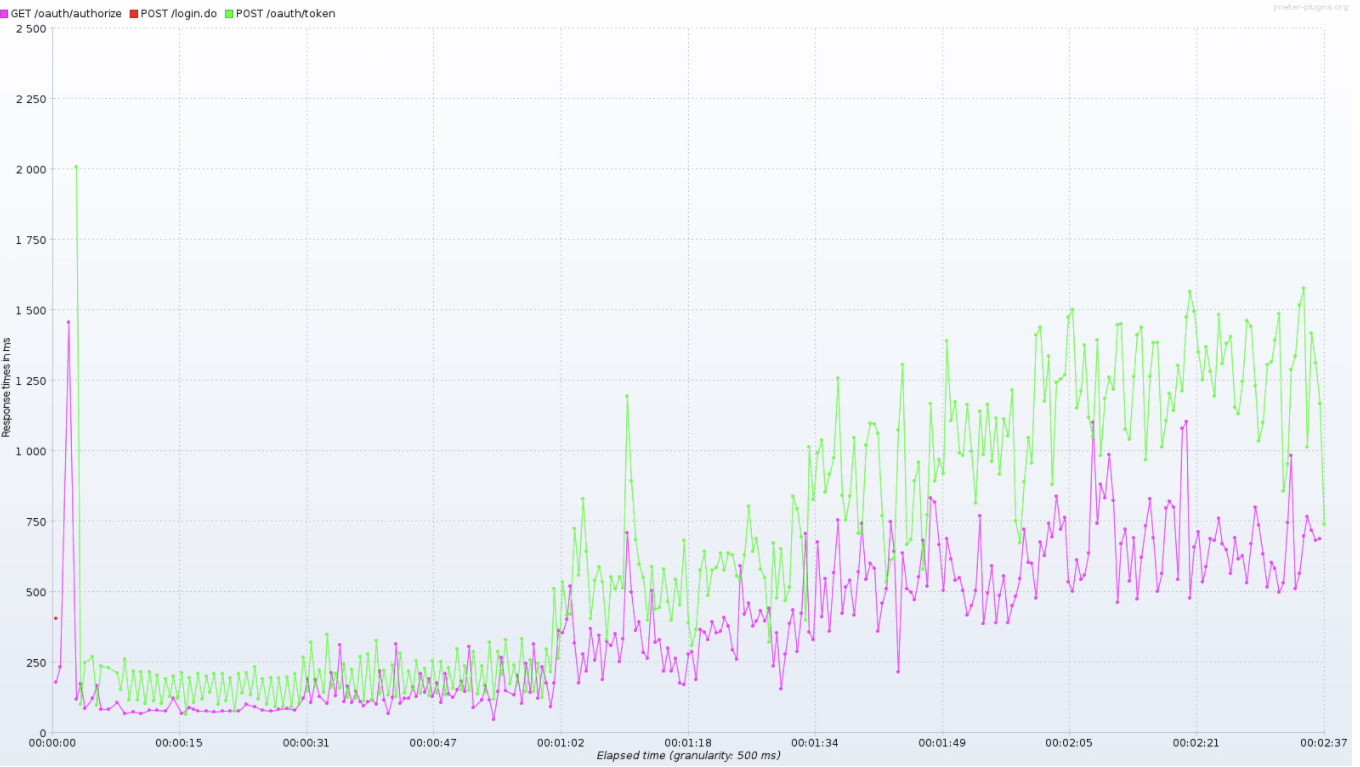
- Authorization code /oauth/authorize and /oauth/login flow
- Client credentials /oauth/token flow
- Implicit /oauth/authorize flow
- Password /oauth/token flow
Each request generated by JMeter is:
- Sent to the router HTTPS protocol
- Includes UAA URL as Host Header (used by Gorouter to decide the host)
- Includes client credentials as a URL parameter
- For authorization code and implicit grant types, an initial login is performed and JSESSIONID is passed for subsequent authorize and token requests
- For password grant type, user credentials are included as URL parameters
When JMeter receives a response from UAA, it:
- Validates response code to ensure request is successful.
JMeter stores each request entry to in an intermediate JTL(CSV) format file and this is used as an input to generate graphs.
We simulate increasing load by ramping up the number of concurrent threads in increments of 20 threads until we reach the equivalent of 200 threads per VM. This allows us to observe the behavior of UAA as the load increases to give us a better understanding of how UAA behavior changes as load increases.
Tools
JMeter test plan: A collection of JMeter scripts. UAA testing for this topic uses these scripts with JMeter to load test, measure, and analyze performance. JMeter supports variable parameterization, response assertions and validation, and graph generation.
Benchmarking setup
- VM Instance Properties
- GCP Cloud Config Name: n1-standard-2
- GCP Machine Type: n1-standard-2
- CPU Information: 2 x Intel® Xeon® CPU @ 2.60GHz
- RAM Information: 7479 MB
- UAA Max Heap Size: 768 MB
- UAA Version:
v53.1branch of UAA
- Database Instance Properties
- GCP Cloud Config Name: n1-standard-2
- CPU: 2 x Intel® Xeon® CPU @ 2.60GHz
- RAM Information: 7479 MB
- Allocated Storage: 10Gb of Persistent Disk
- Engine: MySQL
- Network Setup:
- MySQL deployed with CF deployment so the connection from UAA to database within the same network
- GCP does not document any network bandwidth on any vm types
- Gorouter is scaled to 8 GB memory to prevent router bottlenecks
- Data Configuration: Test dataset includes the following:
- 1 client
- 1 User
- 41 Groups
Performance results
Client credentials grant type
Endpoint: /oauth/token?grant_type=client_credentials
| Instances | Threads | Throughput |
|---|---|---|
| 1 |  |
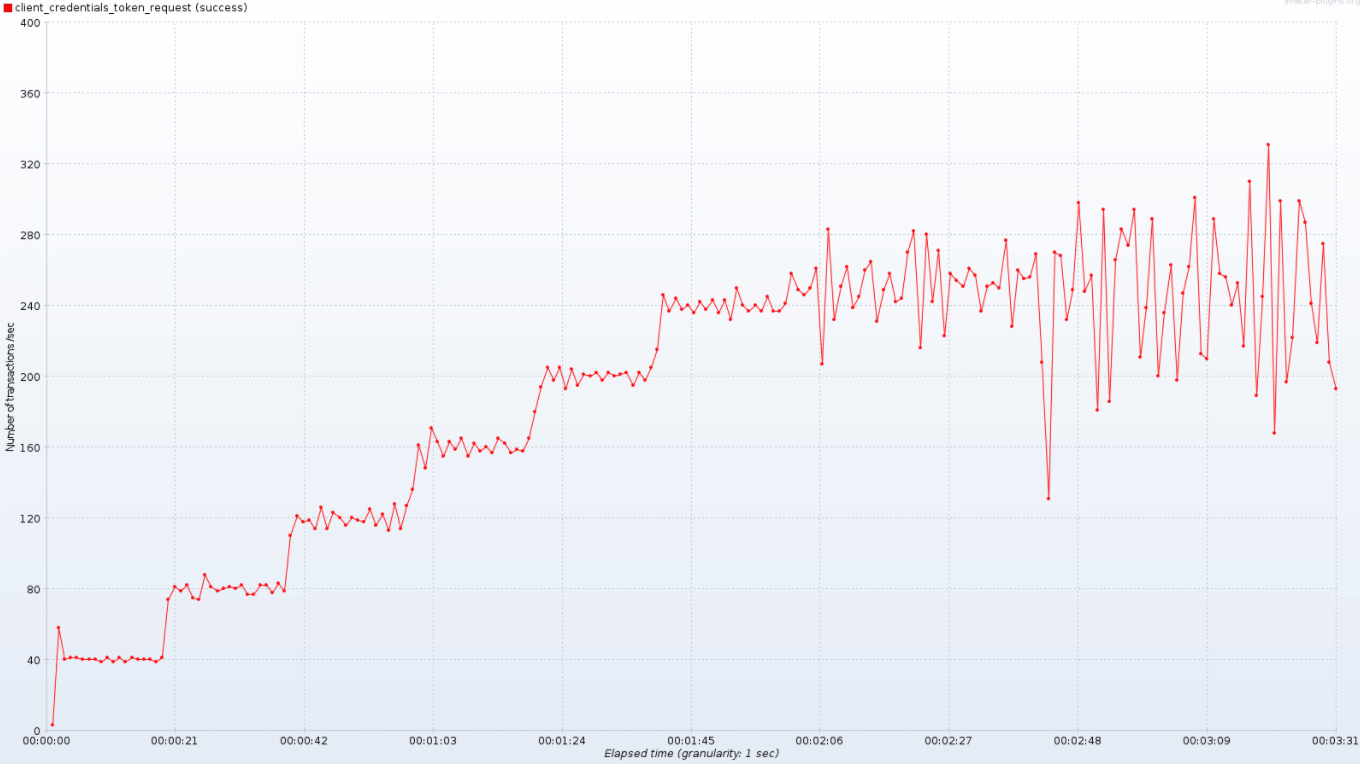 |
| 2 |  |
 |
| 4 | 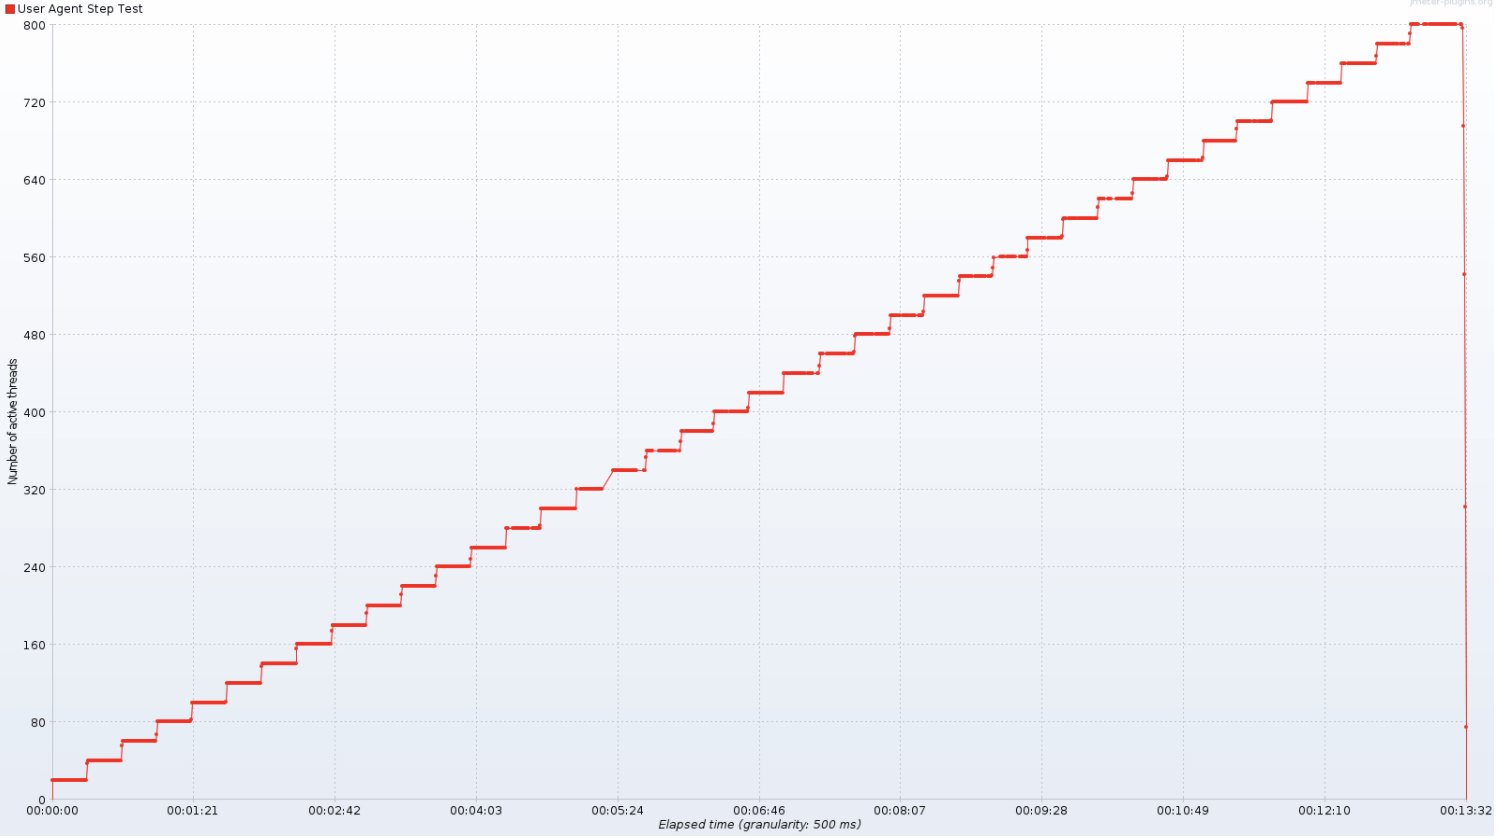 |
 |
| Instances | Threads | Latency |
|---|---|---|
| 1 | |
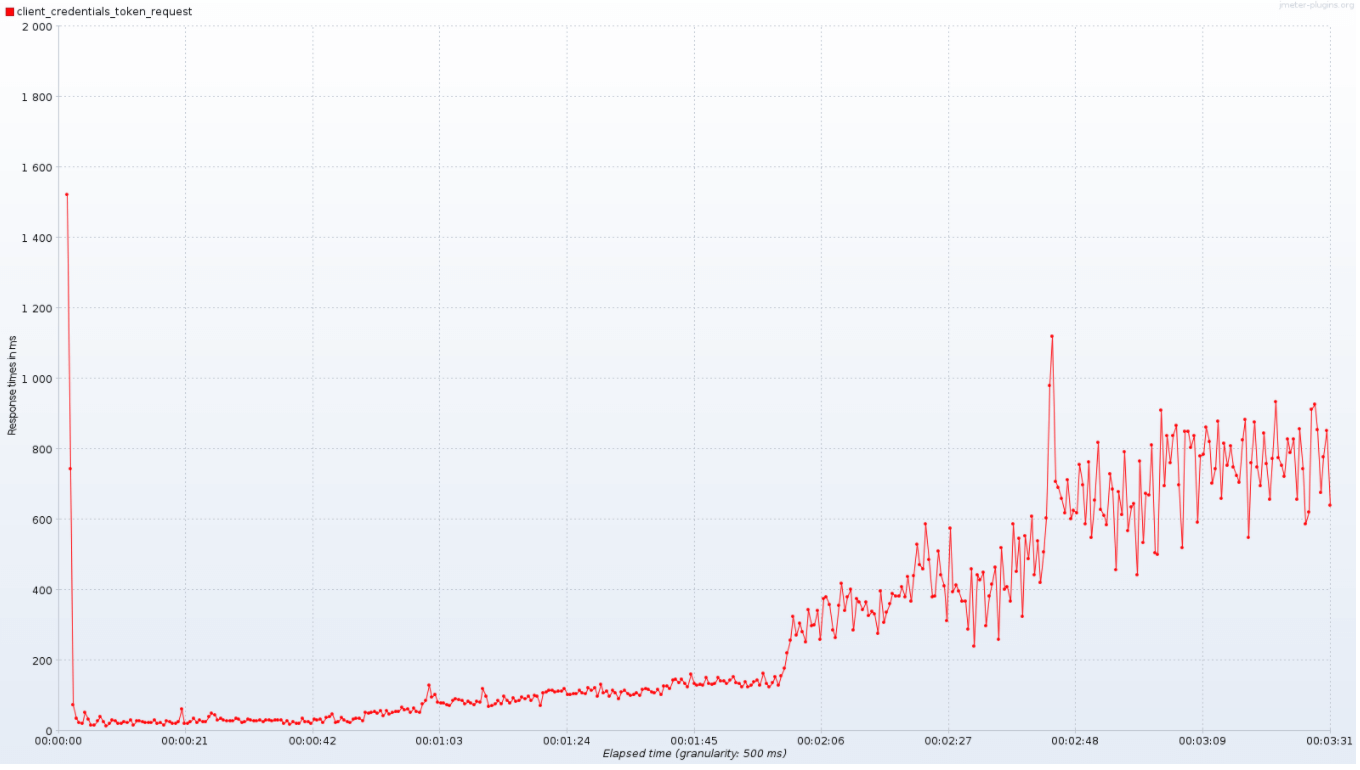 |
| 2 | |
 |
| 4 | |
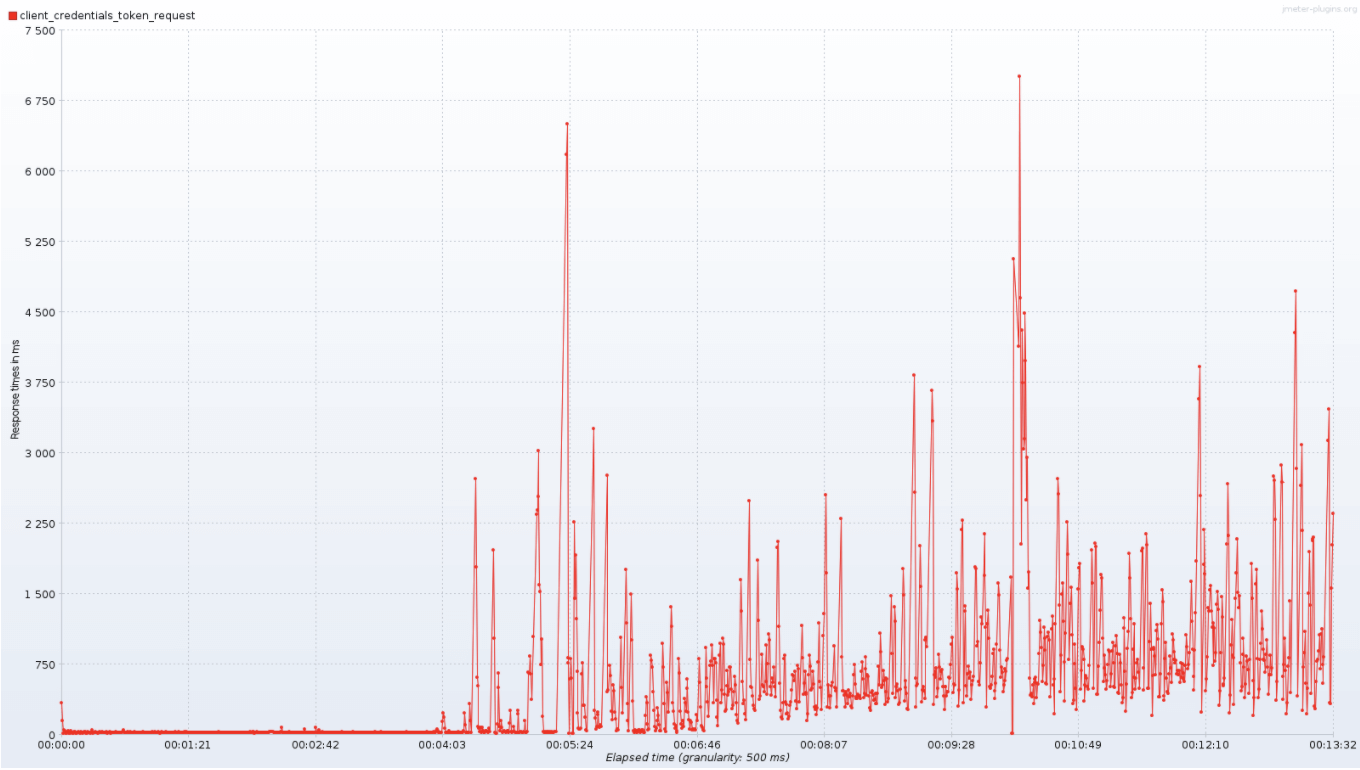 |
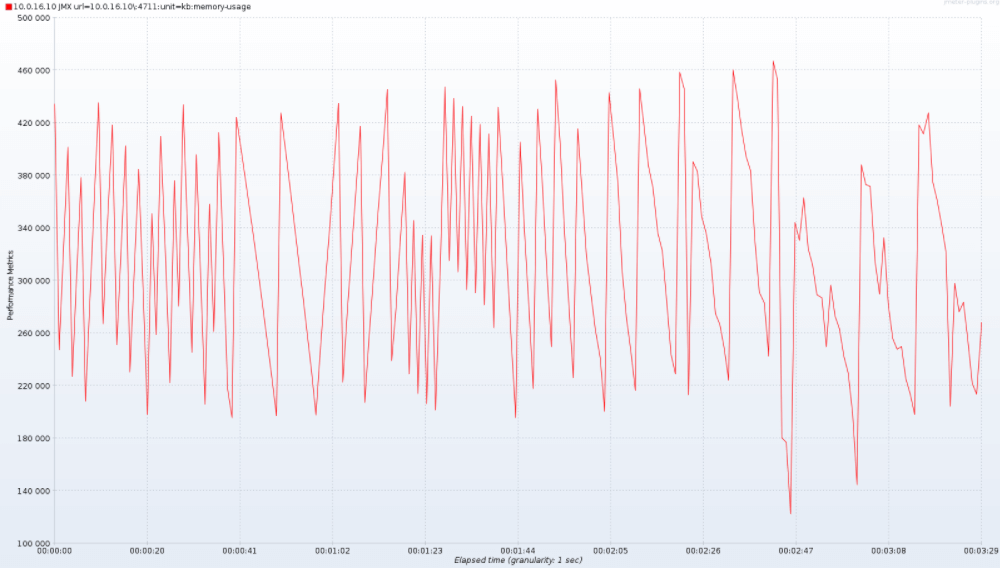
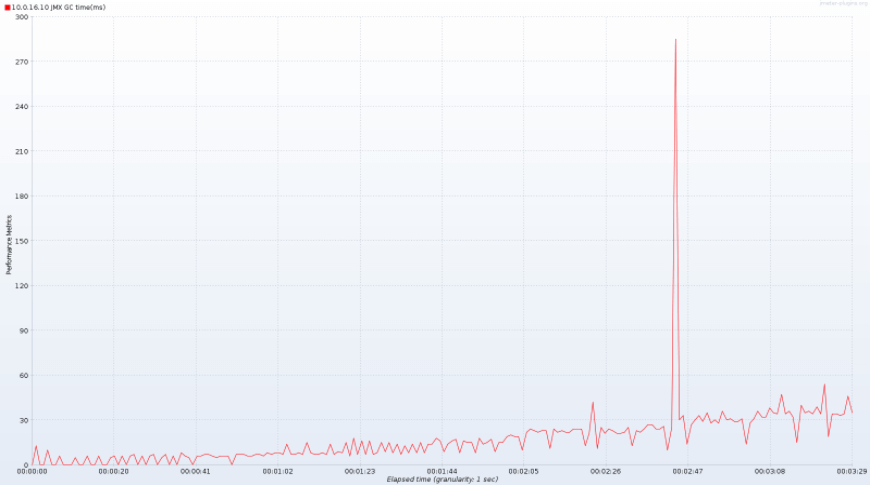
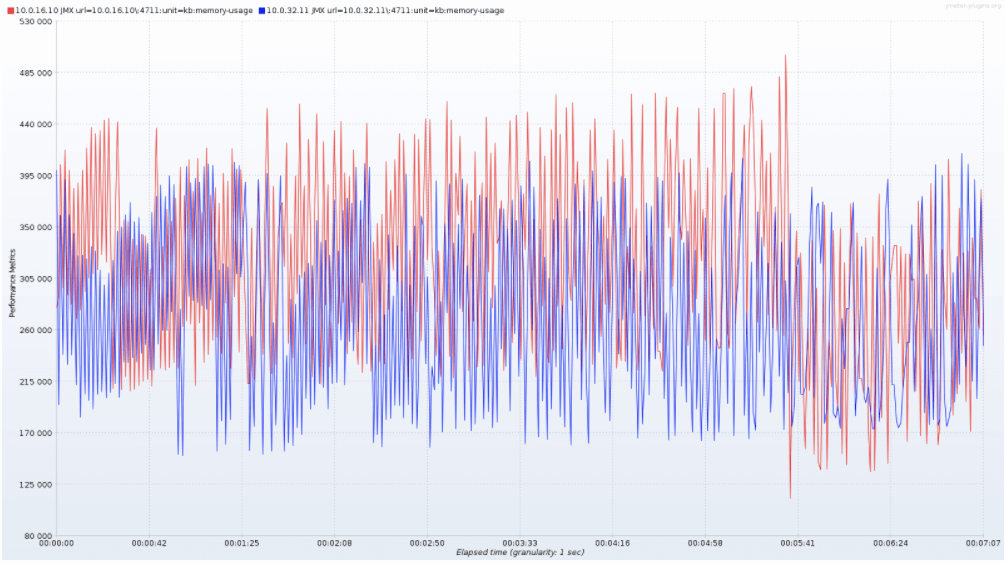
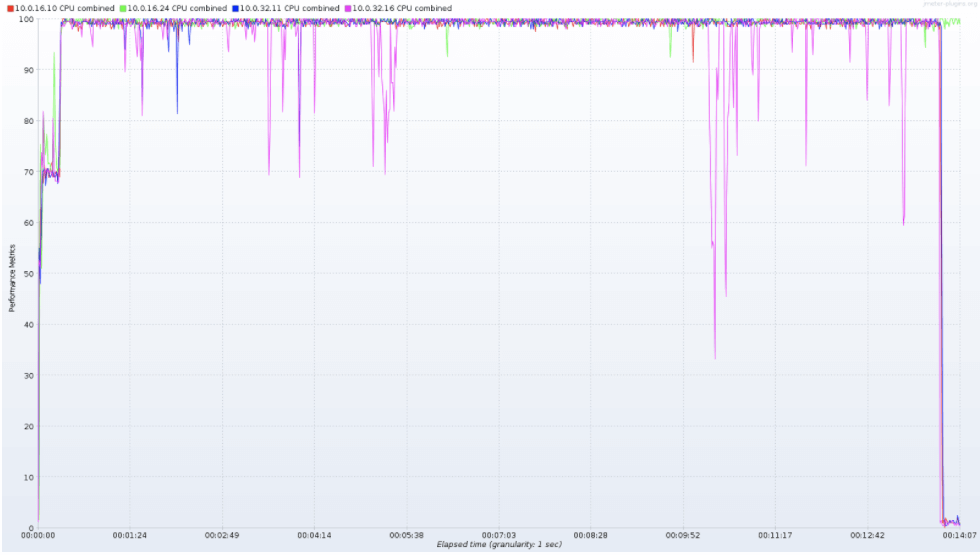
Server Performance metric like CPU utilization, heap memory usage, and time spent in garbage collection. These metrics are collected by an agent colocated with the UAA VM. Graphs are plotted as time series.
| Instances | Threads | CPU | Heap Memory | Garbage Collection |
|---|---|---|---|---|
| 1 | |
 |
 |
 |
| 2 | |
 |
 |
 |
| 4 | |
 |
 |
 |
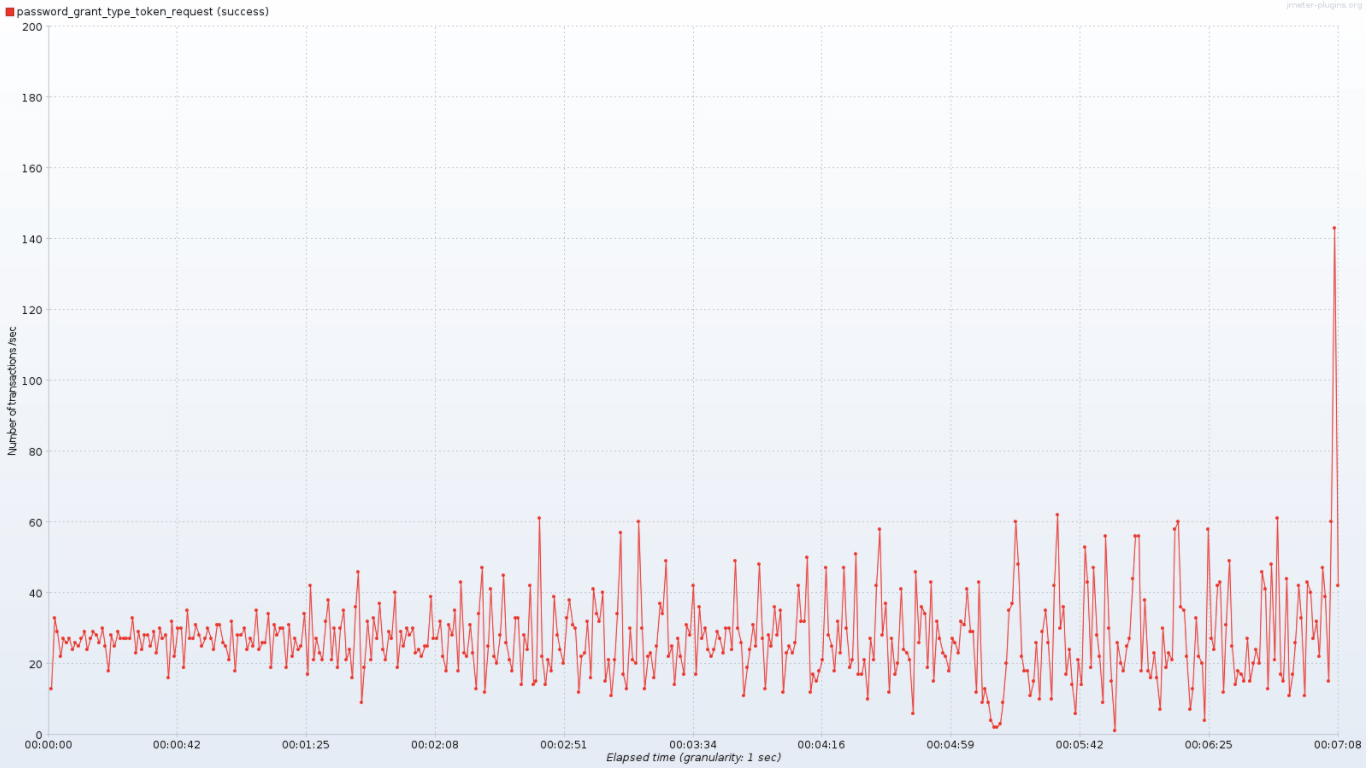
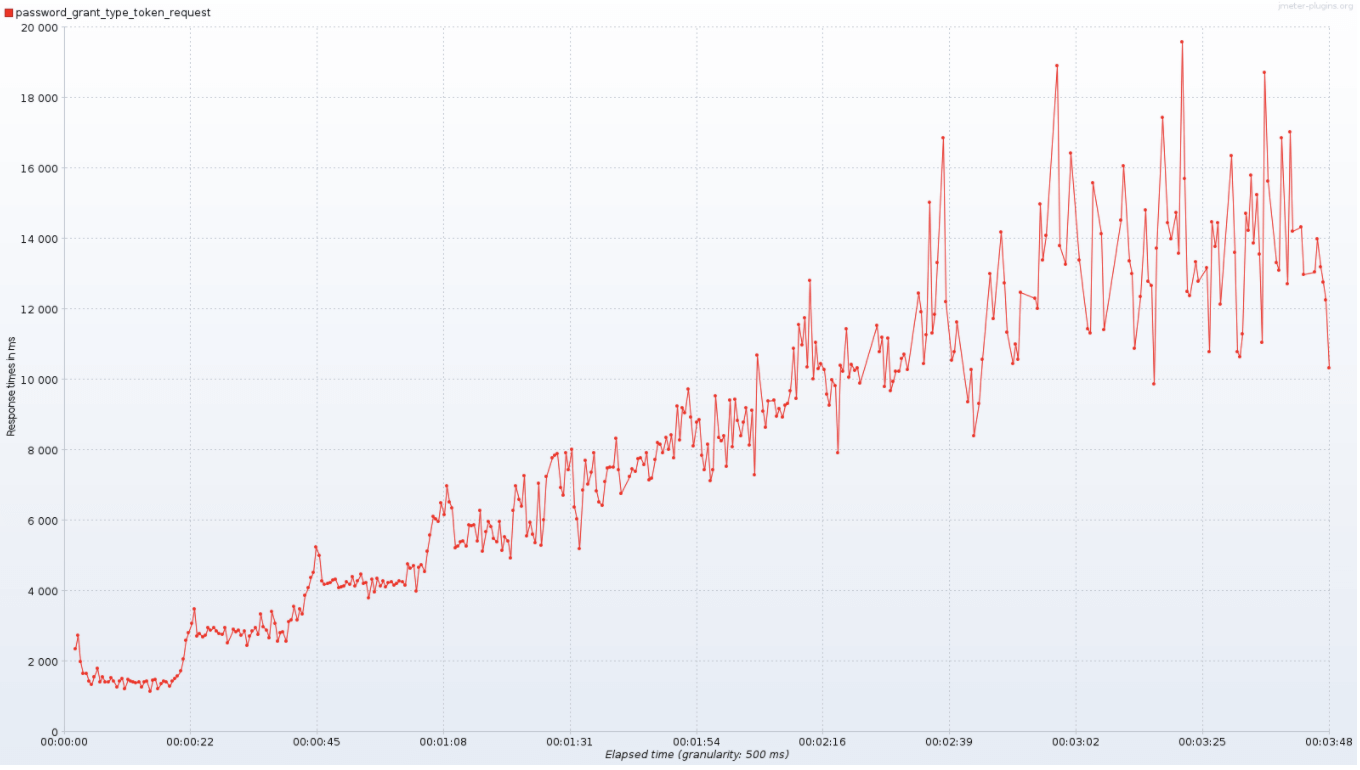
Password grant type
Endpoint: /oauth/token?grant_type=client_credentials
| Instances | Threads | Throughput |
|---|---|---|
| 1 |  |
 |
| 2 |  |
 |
| 4 |  |
 |
| Instances | Threads | Latency |
|---|---|---|
| 1 | |
 |
| 2 | |
 |
| 4 | |
 |
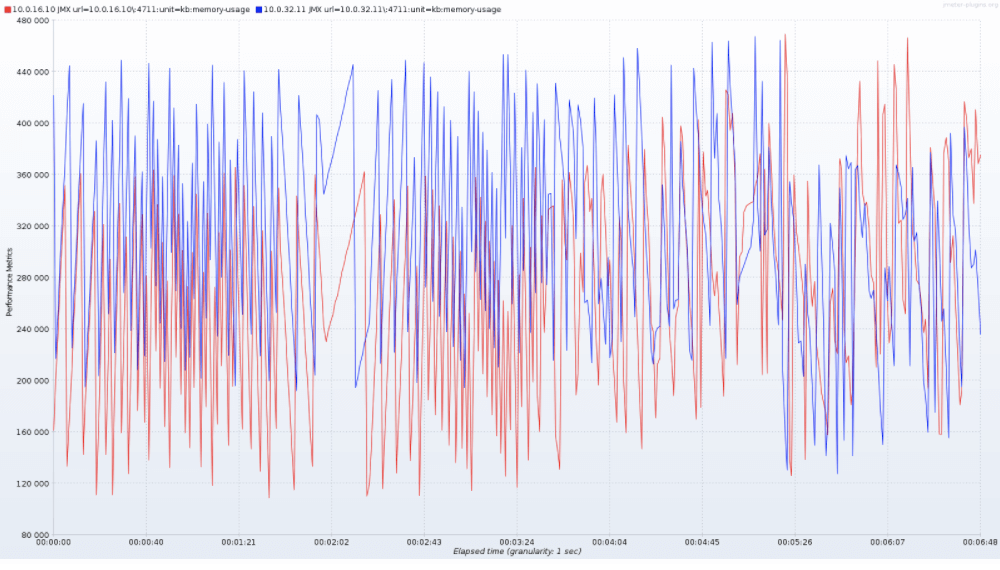
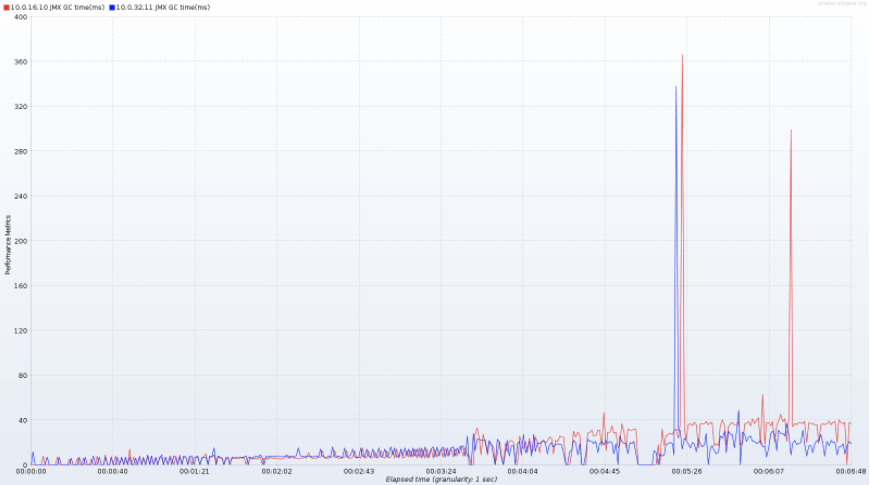
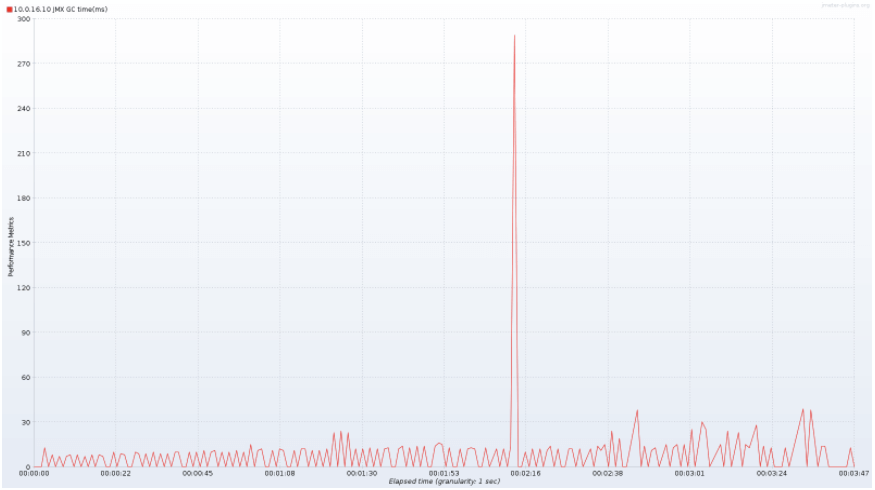
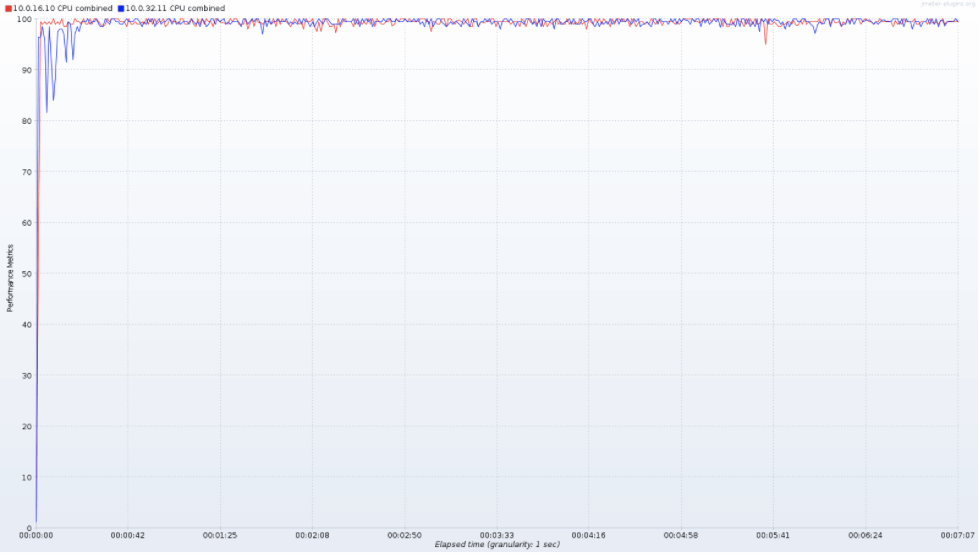
Server Performance metric like CPU utilization, heap memory usage, and time spent in garbage collection. These metrics are collected by an agent co-located with the UAA VM. Graphs are plotted as time series.
| Instances | Threads | CPU | Heap Memory | Garbage Collection |
|---|---|---|---|---|
| 1 | |
 |
 |
 |
| 2 | |
 |
 |
 |
| 4 | |
 |
 |
 |
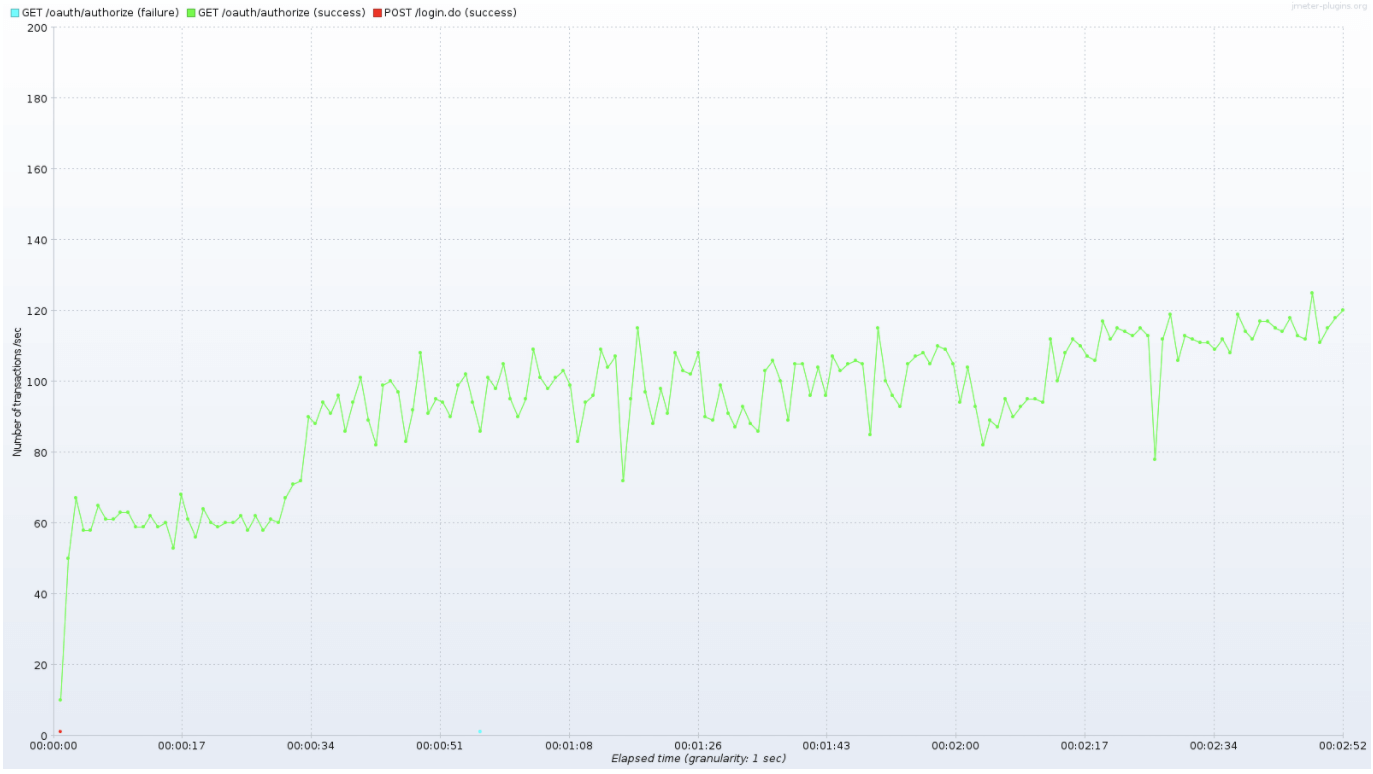
Authorization code grant type
Endpoint: /oauth/authorize?grant_type=authorization_code and /oauth/token?grant_type=authorization_code
| Instances | Threads | Throughput |
|---|---|---|
| 1 | 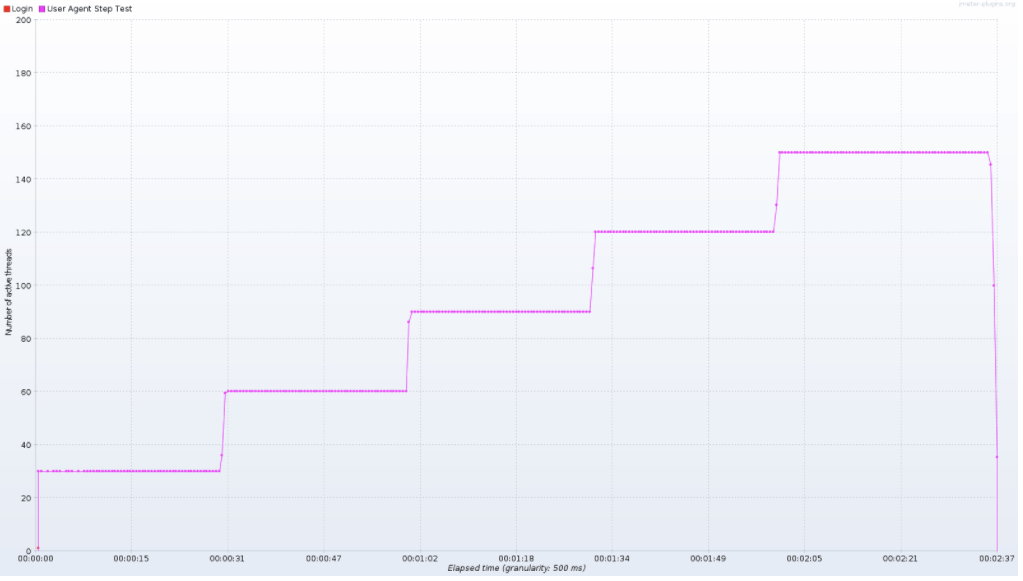 |
 |
| Instances | Threads | Latency |
|---|---|---|
| 1 | |
 |
Server Performance metric like CPU utilization, heap memory usage, and time spent in garbage collection. These metrics are collected by an agent colocated with the UAA VM. Graphs are plotted as time series.
| Instances | Threads | CPU | Heap Memory | Garbage Collection |
|---|---|---|---|---|
| 1 | |
 |
 |
 |
Implicit grant type
Endpoint: /oauth/token?grant_type=client_credentials
| Instances | Threads | Throughput |
|---|---|---|
| 1 | 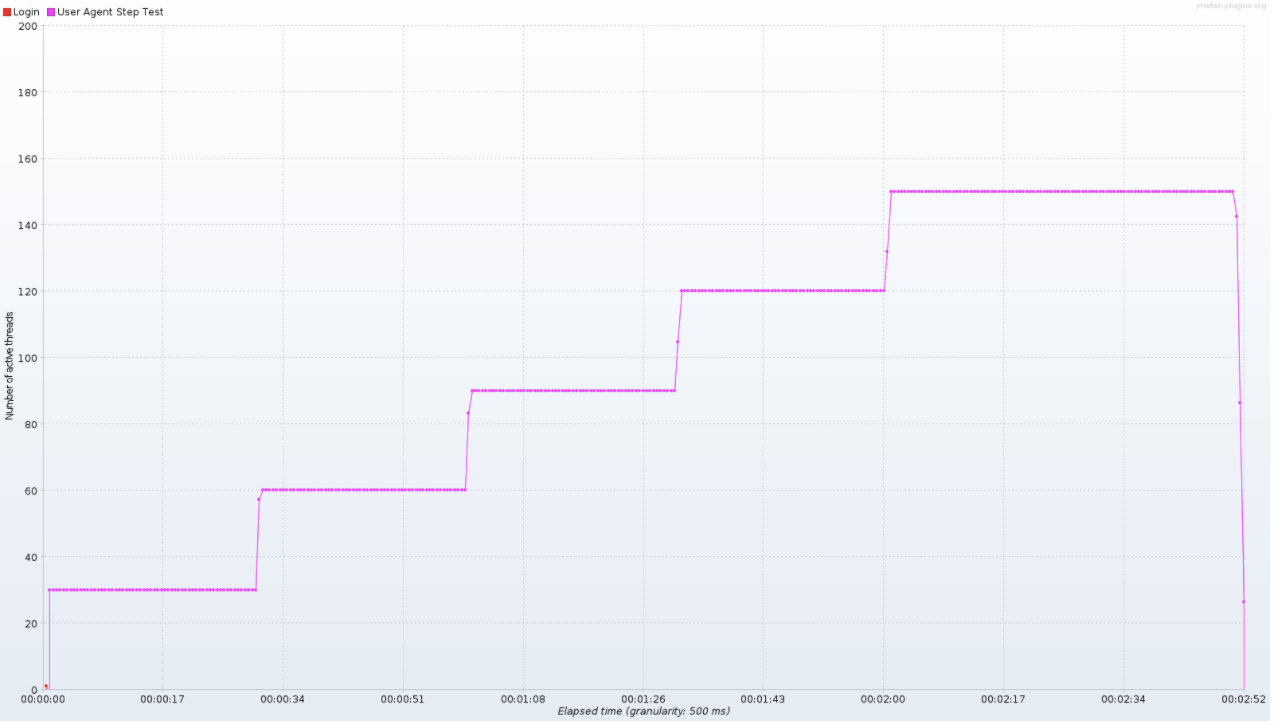 |
 |
| Instances | Threads | Latency |
|---|---|---|
| 1 | |
 |
Server Performance metric like CPU utilization, heap memory usage, and time spent in garbage collection. These metrics are collected by an agent colocated with the UAA VM. Graphs are plotted as time series.
| Instances | Threads | CPU | Heap Memory | Garbage Collection |
|---|---|---|---|---|
| 1 | |
 |
 |
 |