Streaming app logs to third-party services
Page last updated:
Here are instructions for configuring some third-party log management services for your Cloud Foundry apps.
After you configure a service, see Third-party log management services for instructions for binding your app to the service.
Logit.io
From your Logit.io dashboard:
Identify the Logit ELK stack you want to use.
Click Logstash Configuration.
Note your Logstash Endpoint.
Note your TCP-SSL, TCP, or UDP Port (not the syslog port).
Create the log drain service in Cloud Foundry.
$ cf cups logit-ssl-drain -l syslog-tls://ENDPOINT:PORT
or
$ cf cups logit-drain -l syslog://ENDPOINT:PORT
Bind the service to an app.
$ cf bind-service YOUR-CF-APP-NAME logit-ssl-drain
or
$ cf bind-service YOUR-CF-APP-NAME logit-drain
Restage or push the app using one of these commands:
$ cf restage YOUR-CF-APP-NAME
$ cf push YOUR-CF-APP-NAME
After a short delay, logs begin to appear in Kibana.
Papertrail
From your Papertrail account:
Click Add System. The Dashboard appears.
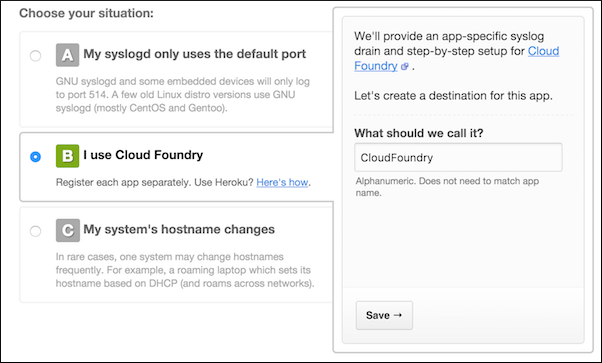
Click the Other link. The Setup Systems screen appears.
Click I use Cloud Foundry, enter a name, and click Save.
After the system is recorded, the URL, with the port, is displayed. Record the URL and port for later use.

Create the log drain service in Cloud Foundry.
$ cf cups my-logs -l syslog-tls://logs.papertrailapp.com:PORT
Bind the service to an app.
$ cf bind-service APPLICATION-NAME my-logs
Restage the app.
$ cf restage APPLICATION-NAME
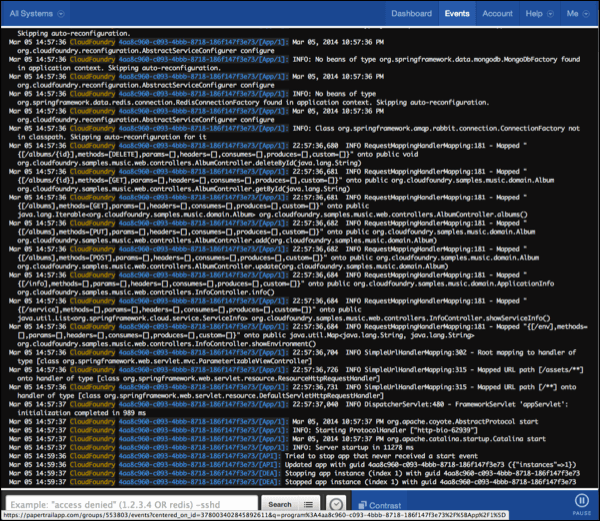
After a short delay, logs begin to flow.
When Papertrail starts receiving log entries, the view changes to show the logs viewing page.
Splunk
See Streaming app logs to splunk for details.
Splunk Storm
From your Splunk Storm account:
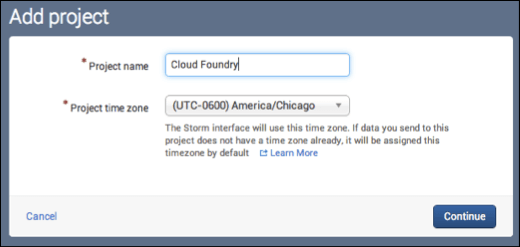
Click Add project. On the dialog box that appears, enter the Project name and select the Project time zone. Click Continue.
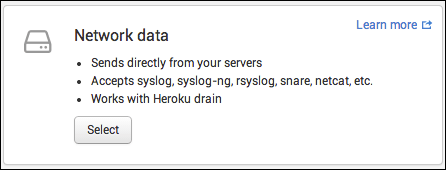
In Network data, create a new input. Under Network data, click Select. Data is sent directly from your servers, and accepted data types include syslog, syslog-ng, snare, and netcat.
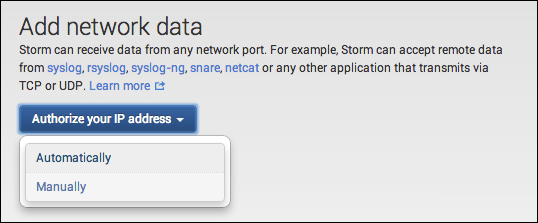
Under Add network data, click Authorize your IP address and select Manually. Next, enter the external IP addresses your Cloud Foundry administrator assigns to outbound traffic.
Record the host and port provided for TCP input for later use.
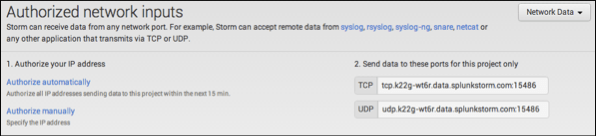
Using the cf CLI, create the log drain service in Cloud Foundry using the TCP host and port you recorded. Then you bind the service to an app and restage the app using the syntax shown here. After a short delay, the logs begin to flow.
$ cf cups my-logs -l syslog://HOST:PORT
$ cf bind-service APPLICATION-NAME my-logs
$ cf restage APPLICATION-NAME
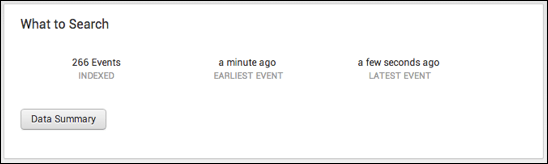
When events begin to appear, click Data Summary. The Data Summary button appears in the What to Search section.
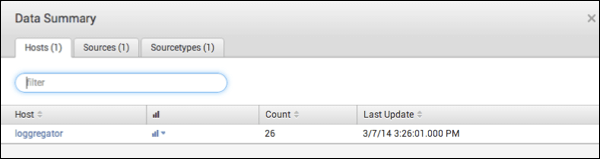
In the Data Summary table, click the loggregator link to view all incoming log entries from Cloud Foundry.
SumoLogic
SumoLogic uses HTTPS for communication. HTTPS is supported in Cloud Foundry v158 and later.
In your SumoLogic account:
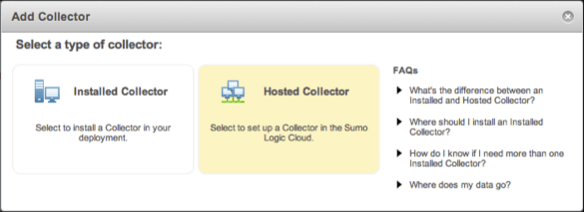
Beside Manage Collectors and Sources, click the Add Collector link.

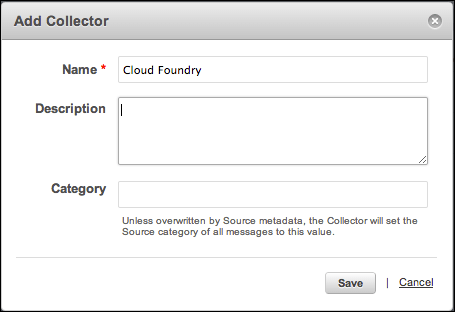
Under Add Collector, select Hosted Collector and fill in the details.
- In Name, enter
Cloud Foundry. - In Description, enter the purpose of the new collector.
In Category, you can enter the source category, if you want. The collector sets the source category to this value unless it is overwritten by the source metadata.
- In Name, enter
Click Save.
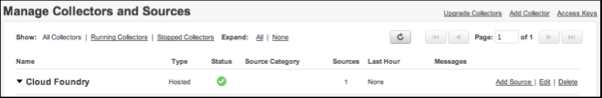
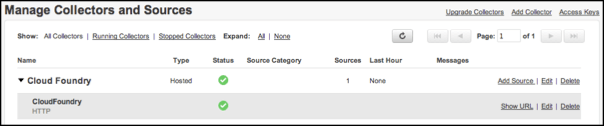
In the Manage Collectors and Sources table, in the row for the new collector, click the Add Source link.
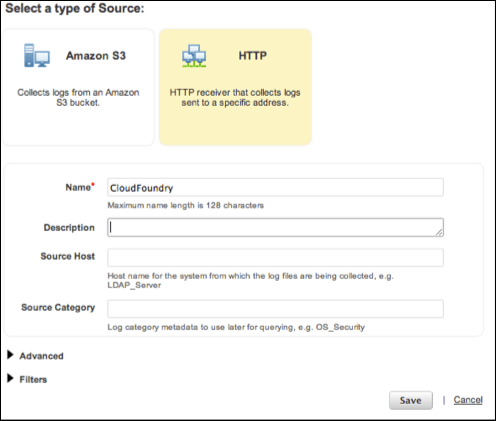
Under Select a type of Source, select HTTP and fill in the details. An HTTPS URL is provided.
- In Name, leave the entry,
Cloud Foundry`. - In Description, enter a description of the source.
- In Source Host, enter the host name for the system from which the log files are being collected.
- In Source Category, enter the log category metadata. You can use this later in queries.
- In Name, leave the entry,
When the source is created, a URL is displayed. You can also view the URL by clicking the Show URL link beside the newly created source in the Manage Collectors and Sources table. Record the URL for the next step.
Using the cf CLI, create the log drain service in Cloud Foundry using the source URL you just recorded. Then you bind the service to an app and restage the app using the syntax shown here. After a short delay, the logs begin to flow.
$ cf cups my-logs -l HTTPS-SOURCE-URL
$ cf bind-service APPLICATION-NAME my-logs
$ cf restage APPLICATION-NAME
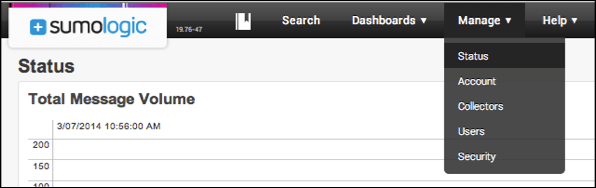
In the SumoLogic dashboard, click Manage, then click Status to see a view of the log entries.
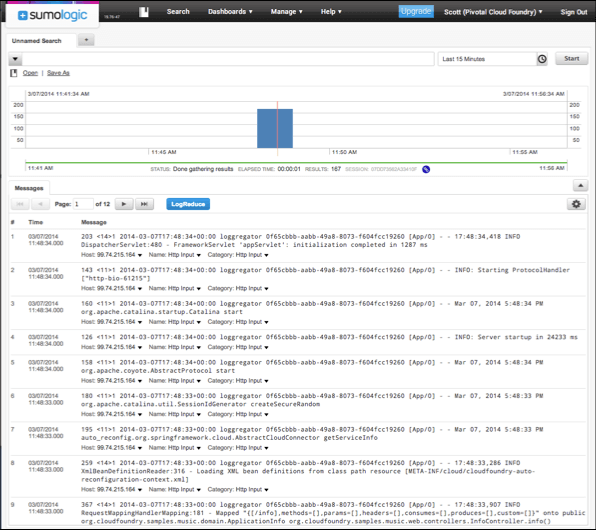
Click Search. Place the pointer in the search box, then click Enter to submit an empty search query.
Logsene
Logsene uses HTTPS for communication. HTTPS is supported in Cloud Foundry v158 and later.
In your Sematext account:
Click the Create App / Logsene App menu item. Enter a name and click Add Application to create the Logsene App.
Using the cf CLI, create the log drain service using the source URL displayed. Then you bind the service to an app and restage the app using the syntax shown here. After a short delay, the logs begin to flow. The logs appear in the Logsene UI.
$ cf cups logsene-log-drain -l https://logsene-cf-receiver.sematext.com/YOUR_LOGSENE_TOKEN
$ cf bind-service YOUR-CF-APP-NAME logsene-log-drain
$ cf restage APPLICATION-NAME
Logentries is not supported
Using Logentries is discouraged because it does not support multiple syslog sources. Cloud Foundry distributes log entries over multiple servers to handle the load.
Create a pull request or raise an issue on the source for this page in GitHub